
Maprams


Tutorial
Plot types

About
Maprams
INTRODUCTION
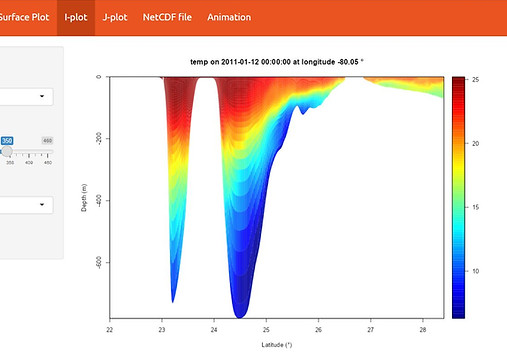
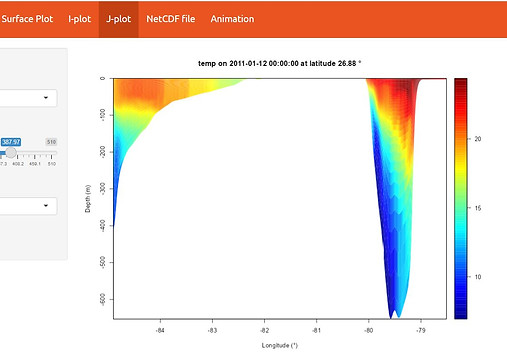
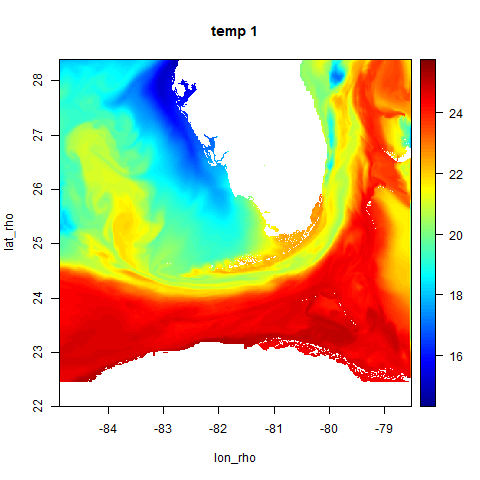
Maprams is an application built using the R-framework and can be used to make plots including surface views, cross-sectional views (I-plot, J-plot), zoom plots and animations from NetCDF files. It is primarily developed to view ROMS (Regional Ocean Modeling System) output files, including their cross-sectional plots at a particular longitude and latitude.
The depth or vertical stretching at a particular longitude and latitude are calculated following this link: https://www.myroms.org/wiki/Vertical_S-coordinate. The data for the plots are sliced or generated using the ocean_time and level (for ROMS file), or from the third and fourth dimension for other NetCDF files.
DOWNLOAD AND INSTALLATION
Maprams can be downloaded for both Windows and Mac based on user preference. Maprams can be downloaded as an executable file.
The installation is straightforward. After the executable file is downloaded, the user can right click and run as administrator or double-click the executable file and allow the application to be installed on the desktop. After a successful installation, the application can be opened from Windows Start.
ERRORS
The user is advised not to tamper with the installation files to avoid errors or application crash. All errors generated can be documented and forwarded to the developer through email (abrahamabiola3@gmail.com). The errors would be fixed as soon as possible. The users should also look out for subsequent versions that would be released, as they would have addressed bugs and better interface for users and other added functions.
HOW TO USE
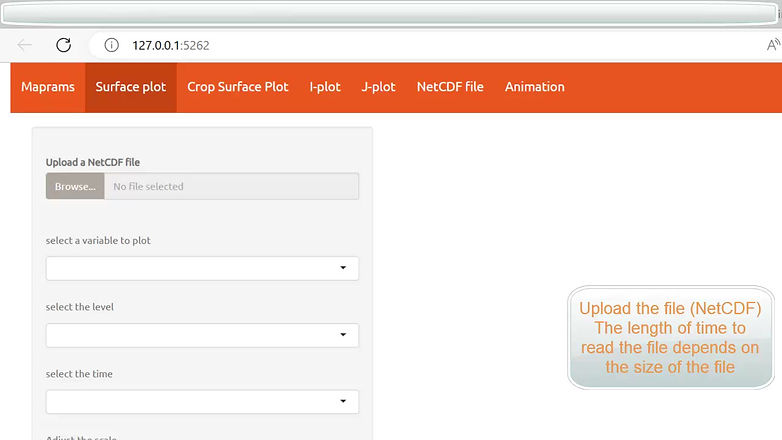
The user is expected to upload the NetCDF file on the Surface plot tab. The file is first analyzed to know if it is a ROMS ouput file or not. If it is a ROMS output file, the user can use the Surface plot, Crop Surface Plot, I-plot, J-plot and Animation to view the surface plots and cross-sectional plots. However if the file is scanned and not a ROMS output file, the user is advised to use the NetCDF file tab which can handle other type of NetCDF files, as the user can easily specify the parameters to plot. The user is however limited to the use of NetCDF files and Animation.
CONTACT
Maprams was developed by Abiola Adebiyi, a PhD student at Florida Atlantic University, USA. Bugs, and recommendations can be forwarded to him at abrahamabiola3@gmail.com.
ACKNOWLEDGMENTS
Maprams is majorly built on the R-framework, R Shiny, the vertical stretching equations by ROMS, and Google Chrome Portable.
Contact
Abiola Adebiyi
Bugs or errors can be sent to this email for a fix. Suggestions are also welcome...